Restoration management tool: simple indicators
First of all, how can we monitor the financial health of restaurants? Koust is a restaurant management tool. Spreadsheets exist to analyse the results, but their use quickly becomes complex. The simplest way to analyse the results of a restaurant is a financial statement.
Free Trial | Koust Application
This state can be broken down into 4 indicators:
- La constitution du Chiffre d’affaires,
- Raw material expenses,
- personnel expenses,
- Operating costs: rather fixed costs compared to the previous ones. (do not vary in proportion to the company's business volume)
The advantage of this state is that you get an immediate overview of the state of health of the company without getting lost in the details.
De “bons” ratios ou pourcentages sont prédéterminés. Le pourcentage de chacun de ces indicateurs est calculé par rapport au chiffre d’affaires. Un pourcentage de 100 % est attribué au chiffre d’affaires. Par exemple : matière première/chiffre d’affaires = 28 %.
These ratios make it possible to evaluate a company's performance using a series of predetermined financial ratios. The most remarkable thing is that this ratio analysis is very simple and very useful to visualize the profitability of a restaurant. It also helps to measure the financial performance of a restaurant business.
"What gets measured gets better. "-Seth Godin
The indicators of this restoration management tool
Raw material consumption: Invoice management
First of all, invoice entry is integrated into the KOUST catering management tool. In addition, the accumulation per month allows to constitute the monthly raw material expenses. The expenses of "liquid" and "solid" foodstuffs are cumulated here.
Sales: Importing sales from the cash register
En important les ventes de la caisse, le logiciel permet de visualiser le chiffre d’affaires mensuel de l’établissement.
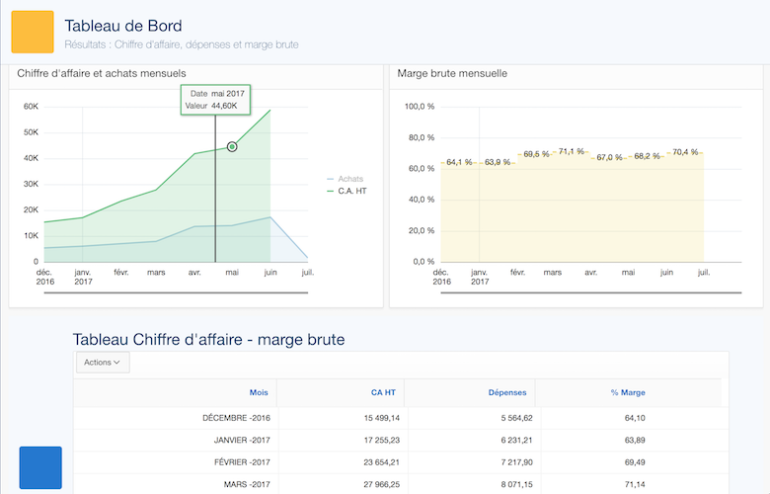
 Balance Sheet: Results Tables
 Balance Sheet: Results Tables
Le Tableau des résultats regroupe les deux indicateurs précédents : Chiffre d’affaires et dépenses en matière première. Enfin, les résultats et ratio sont représentés :
- in table and curve form,
- in monthly value and 12-month cumulative value.
En conclusion, la capacité à bien gérer ce rapport matière première/chiffre d’affaires va vous donner les moyens d’augmenter les dépenses de personnel.
"In the long run, you can only make progress if you have exceptional people around you" - Mark Zuckerberg