Ratio restauration à suivre : Méthodes et formules
Quelle définition pour le ratio restauration ? Quels sont les indicateurs principaux à surveiller dans un restaurant ?
Et, quand on parle de gestion de restaurant, la question arrive rapidement : on se demande quels sont les ratios importants et quels indicateurs financiers mettre en place pour bien gérer son établissement ? En effet, pour développer son entreprise, les efforts sont importants et disposer des meilleurs leviers est indispensable. Découvrez, grâce à Koust, comment se focaliser sur ses indicateurs et accroitre la rentabilité et le chiffre d’affaires par les actions qui en découlent.
Les éléments présentés ici visent à aider les restaurateurs dans leur gestion grâce aux ratios et calculs des marges. Le logiciel Koust permet de réaliser ces calculs simplement.
Tout d’abord, un ratio est un pourcentage utilisé pour l’analyse de données de l’activité, des coûts et du résultat de l’entreprise. Il existe différents types de ratios, dans la restauration, on parle principalement de ratio de marge.
Les indicateurs de contrôle d’activité
Tout d’abord, les principaux indicateurs clé de gestion en restauration sont :
- Le suivi du chiffre d’affaires
- la marge brute
- le ratio coût matière et CA
- nombre de couverts
- panier ou ticket moyen
- coef. Multiplicateur
Ce ratio restauration est évalué sur des périodes prédéfinies : mois, semaine, année. Ils permettent d’évaluer le degré d’activité et de productivité du restaurant.
La moyenne du nombre de couverts par service est le nombre total de clients sur une période divisée par le nombre de services sur la même période.
Moyenne nombre de couverts par service = Nombre de clients total /nombre de services
Le ticket moyen est la dépense moyenne par client sur un service
Ticket moyen = CA TTC /nombre de clients
La marge brute : principal ratio restauration
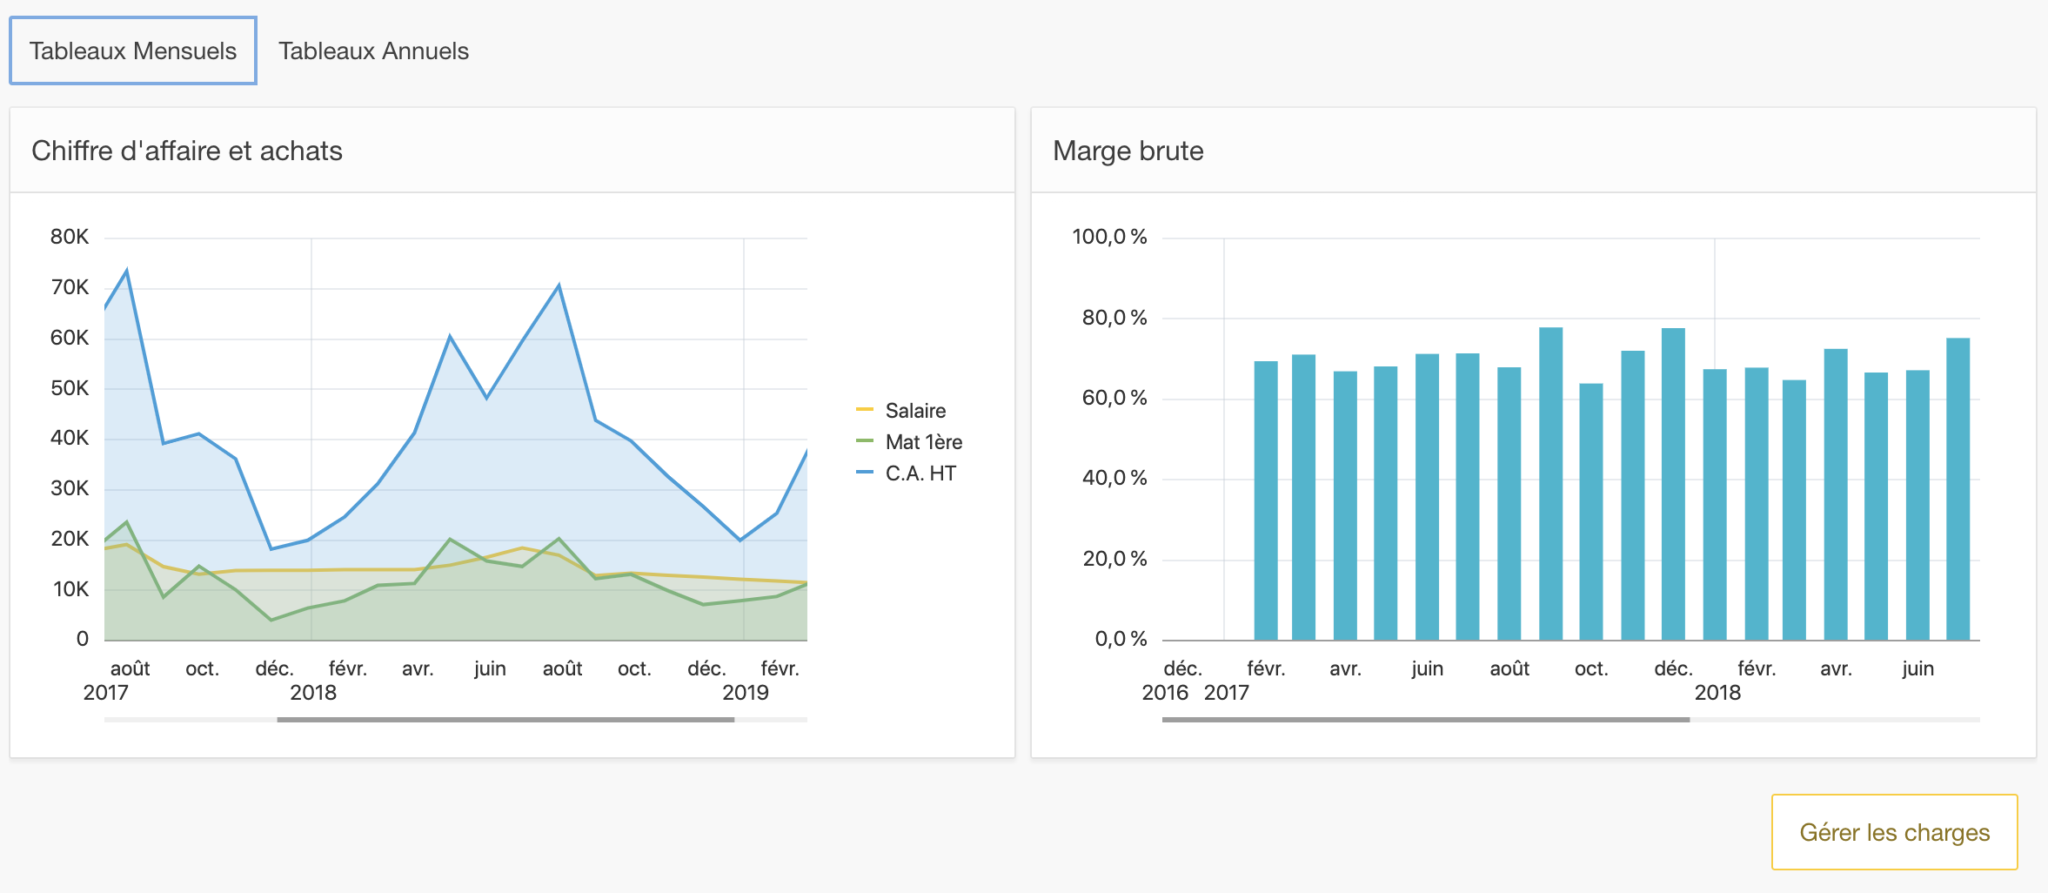
La marge peut se calculer au niveau de chaque recette ou de façon globale sur une période donnée. Alors, on cumule les achats de matières premières et le chiffre d’affaires sur la période. C’est cet indicateur global de gestion qui nous intéresse ici pour suivre l’évolution de la rentabilité au fil du temps.
Marge brute = (Chiffre d’affaires HT – Coût matières premières) / Chiffre d’affaires HT
Habituellement, on subdivise le calcul entre les solides et les liquides pour obtenir des résultats plus précis :
- Denrées alimentaires : environ 72 %
- Boissons alcoolisées : plus de 75 %
- Boissons non alcoolisées : plus de 75 %
Pour calculer cette marge, on utilise depuis longtemps les fiches techniques. Elles garantissent aussi la qualité, la régularité en cuisine par définition exacte de la recette. Ces recettes aident aussi les cuisiniers dans leur travail quotidien, à la formation du nouveau personnel et à la conservation du savoir-faire du restaurant.
Méthode rapide d’application de la marge
Appliquer le pourcentage cible de la marge brute n’est pas suffisamment simple pour évaluer le prix de vente d’un plat ou pour estimer le coût matière à consommer pour un plat du jour. La valeur des denrées alimentaires fluctuant rapidement, il faut constamment retourner à ces calculs de marge pour que le résultat obtenu soit cohérent. Les professionnels de la restauration recherchent des méthodes simples pour gagner du temps. C’est pourquoi le coef. multiplicateur est plus utilisé dans le secteur de la restauration.
Les coefficients multiplicateurs : ratio restauration essentiels
Le coefficient multiplicateur (Cm) est l’équivalent de la marge brute par une simple multiplication.
Cm = Chiffre d’affaires HT / Coût matières
On peut donc le calculer à partir de la marge brute :
Cm = 1/ (1- marge brute)
Exemple de calcul des coûts :
Marge brute 70%
Cm = 1/ (1- 0,70) =3,33
Il est plutôt utilisé au niveau de la recette :
Cm = Prix de vente du plat HT / Coût matières
Pour simplifier encore les calculs, on peut intégrer le taux de TVA.
Exemple :
Pour une marge brute ciblée de 72 % avec une TVA à 10 % :
coef = 1/(1- 0,72) x (1+10 %) =3,57 × 1,1 = 3,93
Pour une marge brute ciblée de 75 % avec une TVA à 20 % :
coef = 1/(1- 0,75)x (1+20 %) =4x 1,2= 4,8
En général, on applique un coef plus faible aux produits les plus chers et un coef plus fort aux produits les moins chers. On peut aussi appliquer des coefficients plus fort ou plus faibles sur certaines gammes de produits en fonction de la politique commerciale et de la différenciation choisie par le restaurant.
Évaluer le coût matière à partir d’un coût cible au kilo
Une autre approche peut être d’estimer le coût d’achat des matières premières au kilo. Ici, on prend le problème dans l’autre sens, on détermine le coût d’achat en fonction du prix de vente :
- Partir du prix de vente de la recette (exemple : 15 €)
- Ensuite, enlever la TVA (15 € – 10 % TVA = 13,64 €)
- Puis, appliquer le ratio en divisant le prix de vente par le ratio ou coefficient (exemple : 13,64 €/5 = 2,73 €)
- Enfin, diviser cette valeur cible par une quantité moyenne qu’on applique pour obtenir la valeur au kilo de la matière première (exemple 200 g pour obtenir un prix d’achat cible de 2,73/,20= 13,65 €).
Dans l’exemple, le résultat obtenu est un prix au kilo de 13,65 €. C’est une valeur cible à ne pas dépasser pour garantir la marge brute. Par exemple, ça pourra être le prix au kilo d’une viande.
Ici, on a appliqué un coefficient plus élevé (5) par rapport au fait que l’ingrédient principal ne fait pas tout le prix du plat. Ainsi, cette méthode peut s’appliquer aux plats du jour, aux menus à l’ardoise.
Évaluer le taux de matières premières perdues
En plus du calcul de la marge, il est possible pour les restaurateurs de calculer les pertes. On parle de ratio de “coulage”.
Ratio de coulage = Valeur des pertes / CA
Les charges de personnel
Un autre indicateur important, le ratio charges de personnel. C’est le pourcentage de la masse salariale sur le chiffre d’affaires.
Charges de personnel = Salaire et charges salariales / Chiffre d’Affaires
Prime cost = charges de personnel + Coût matière
Exemple :
marge brute 70%
Donc coût matière = 30%
charges de personnel = 37 000 / 100 000 = 37%Prime cost = 30%+ 37% = 67%
Les charges d’exploitation
Ces charges représentent toutes les autres dépenses comme :
- L’eau, l’électricité, le Gaz et autres énergies
- Les assurances, abonnements divers, consommables et redevances
- Les loyers, la maintenance et l’entretien immobilier
Mais, les charges les plus importantes comme le loyer ou les énergies peuvent représenter une part très importante des charges.
Ces charges peuvent être fixes comme le loyer et d’autres variables, fluctuent en fonction de l’activité et de la gestion. Aussi, une part de la consommation d’électricité peut être fixe et une autre part est liée à l’activité du restaurant. Un tableau de bord peut donc aider à se représenter et à suivre plus facilement l’évolution de ces coûts. Il permet également d’avoir un visuel sur le résultat net de l’entreprise.
Tableau récapitulatif de ratio restauration
| Ratio restauration | Méthode de calcul | Exemple |
| Consommation matières premières | (Achats de matières premières sur période + stock début de période – stock fin de période) / Chiffre d’affaires sur période | 30 % |
| Marge brute | Chiffre d’affaires – consommation matières | 70 %. |
| Coefficient multiplicateur | Chiffre d’affaires /consommation matières | 3,5 |
| Charges de Personnel | (Salaires + charges sociales) / chiffre d’affaires | 35 % |
| Prime cost | (Charges de personnel + Consommation matières) /Chiffre d’affaires | 70 % |
| Ratio Charge d’expl. | Charge d’exploitation / Chiffre d’affaires | 15 % |
COMMENT OPTIMISER LES ratios DANS LE DOMAINE DE LA RESTAURATION ?
Une fois que vous avez identifié vos indicateurs de performance, il est essentiel de chercher des moyens de les améliorer. Cela peut être réalisé en réduisant les coûts globaux, en augmentant la marge des produits et en ajustant les prix de vente. Voici quelques stratégies à mettre en place au niveau de la gestion de la salle de restaurant, de la cuisine et des relations avec les fournisseurs.
GESTION DE LA SALLE DE RESTAURANT :
- Écoutez votre clientèle : Identifiez les produits ou plats populaires et donnez-leur plus de visibilité sur la carte pour augmenter le ticket moyen. Supprimez les plats peu commandés ou peu compétitifs.
- Jouez avec les formules : Proposez des formules variées pour le déjeuner et le dîner avec des prix stables. Mettez en avant vos plats phares sur la carte et dans les supports de communication, en veillant à maintenir des prix calculés pour une marge intéressante.
- Formation du personnel : Formez votre personnel en salle aux techniques de vente et encouragez-les à conseiller les plats à forte marge, les accompagnements additionnels, les desserts, etc.
EN CUISINE :
- Optimisez l’efficacité : Limitez la perte de produits en adaptant les recettes pour réduire les coûts d’investissement. Utilisez des fiches techniques de cuisine pour préciser les quantités nécessaires et limiter le gaspillage alimentaire.
- Gestion des inventaires : Effectuez des inventaires réguliers pour suivre les stocks et éviter les pertes. Cela permet de mieux contrôler les coûts et de prévenir les ruptures de stock.
AVEC LES FOURNISSEURS :
- Optimisez les coûts d’achat : Approchez plusieurs fournisseurs et mettez-les en compétition pour obtenir le meilleur rapport qualité/prix. Choisissez-les attentivement, car ils influent directement sur la santé financière du restaurant.
- Critères de sélection des fournisseurs :
- Catalogue de prix : Vérifiez s’ils respectent les tarifs du marché.
- Livraison et approvisionnement : Assurez-vous qu’ils respectent les délais convenus.
- Souplesse : Choisissez des fournisseurs prêts à récupérer ou recycler les stocks invendus.
En suivant ces stratégies à différents niveaux, vous pouvez améliorer significativement le ratio de restauration de votre établissement.


